
Visualization
Last updated on 2026-06-16 | Edit this page
Overview
Questions
- How do I visualize my NextGen runs?
Objectives
- Explain how the Data Visualizer complements NGIAB.
- Use the Data Visualizer to visualize results of a NextGen run in NGIAB.
Data Visualizer
The Data Visualizer component developed using the Tethys Platform (Swain et al., 2015) complements NGIAB by providing an environment for geospatial and time series visualization of catchments and nexus points (locations where objects in the hydrofabric like streams or water bodies connect). Through a web-based architecture, researchers can explore hydrological data in a spatiotemporal context (CIROH, 2025). In addition to standard map-based displays, this component also supports the visualization of the TEEHR output, including tabular metrics and interactive time series plots.
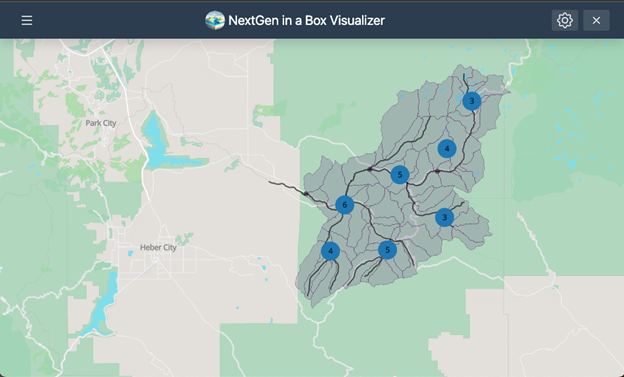
Using the Data Visualizer with NGIAB
ViewOnTethys Script
Like TEEHR, the Data Visualizer can be activated upon execution of
the main NGIAB guide script, guide.sh. A separate
viewOnTethys.sh script is also available in the
NGIAB-CloudInfra repository.
Once a run is complete, users can launch the Data Visualizer through their web browser when prompted by the guide script. Although TEEHR’s outputs can be displayed within the Data Visualizer, this tool is primarily designed to provide a broad overview of model results. Users seeking TEEHR’s more advanced analysis features can still access them outside the Data Visualizer.
One of the advantages of the viewOnTethys.sh script is
that it allows the user to keep multiple outputs for the same
hydrofabric. It prompts the user if they want to use the same output
directory by renaming it and adding it to the collection of outputs or
if they want to overwrite it.
BASH
  ⚠ ~/ngiab_visualizer is not empty.
  → Keep (K) or Fresh start (F)? [K/F]: k
ℹ Reclaiming ownership of ~/ngiab_visualizer  (sudo may prompt)…
  ⚠ Directory exists: ~/ngiab_visualizer/gage-10154200
  → Overwrite (O) or Duplicate (D)? [O/D]: o
  ✓ Overwritten ➜ ~/ngiab_visualizer/gage-10154200
Checking for ~/ngiab_visualizer/ngiab_visualizer.json...
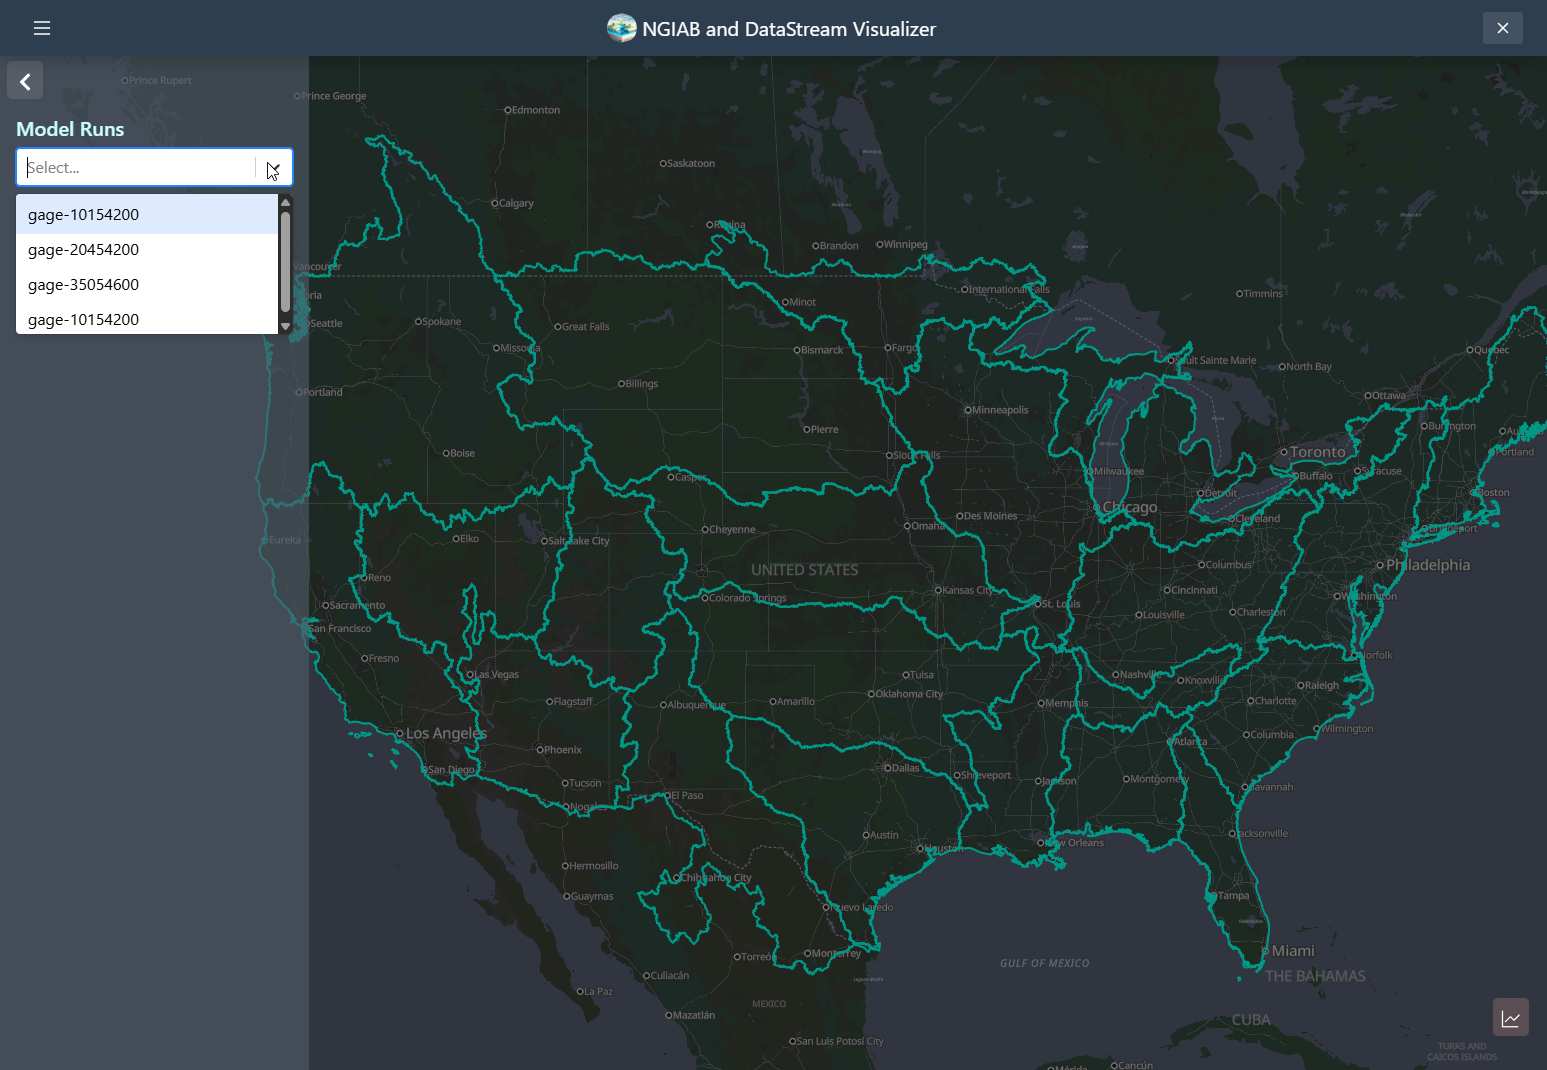
You should be able to see multiple outputs through the UI:
Visualizer Directory Organization
The Visualizer organizes data using a directory named
ngiab_visualizer. This directory stores all the outputs
generated by the user and includes a file called
ngiab_visualizer.json. This file contains metadata that
allows the Visualizer to locate and manage the outputs from different
runs executed via the ./guide.sh script. The metadata,
specific to the Visualizer, is structured as a simple JSON file. It
lists the outputs with details such as a label, the data path, and a
unique identifier. The ./ViewOnTethys.sh script handles the
creation and management of this metadata.
JSON
{
  "model_runs": [
    {
      "label": "gage-10154200",
      "path": "/var/lib/tethys_persist/ngiab_preprocess_output/gage-10154200",
      "date": "2025-05-23:13:51:51",
      "id": "61026834-4235-4d39-8a8e-f076a8854148",
      "subset": "",
      "tags": []
    },
    {
      "label": "gage-20454200",
      "path": "/var/lib/tethys_persist/ngiab_visualizer/gage-20454200",
      "date": "2025-05-23:17:00:34",
      "id": "68f6cf78-188c-4e86-b797-6c40ea36e0e6",
      "subset": "",
      "tags": []
    },
    {
      "label": "gage-35054600",
      "path": "/var/lib/tethys_persist/ngiab_visualizer/gage-35054600",
      "date": "2025-05-23:17:01:10",
      "id": "6d0cb736-2dac-4ea0-a3a3-ad26cd45ef36",
      "subset": "",
      "tags": []
    }
  ]
}
The path /var/lib/tethys_persist/ belongs to the
$HOME env variable of the container running the visualizer.
When the user runs the ./ViewOnTethys.sh, it mounts the
directory from the host at ~/ngiab_visualizer to
/var/lib/tethys_persist/ngiab_visualizer.
However, if the user wants more control, the user can copy their data
directory to ~/ngiab_visualizer on the host (not the
container) while the container is stopped:
Alternatively, the user can open the
~/ngiab_visualizer/ngiab_visualizer.json on the host (not
the container), and add the specific run to the visualizer:
JSON
....
    {
      "label": "gage-35054600",
      "path": "/var/lib/tethys_persist/ngiab_visualizer<MY_SPECIFIC_OUTPUT_DIRECTORY_NAME>",
      "date": "2025-05-23:17:01:10",
      "id": "6d0cb736-2dac-4ea0-a3a3-ad26cd45ef36",
      "subset": "",
      "tags": []
    }
The user can then run ./ViewOnTethys.sh script to spin
up the container again, or if the user wants more control, they can
export the env variables and run the container.
BASH
export CONFIG_FILE="$HOME/.host_data_path.conf"          \
       TETHYS_CONTAINER_NAME="tethys-ngen-portal"        \
       TETHYS_REPO="awiciroh/tethys-ngiab"               \
       TETHYS_TAG="latest"                               \
       NGINX_PORT=80                                     \
       MODELS_RUNS_DIRECTORY="$HOME/ngiab_visualizer"    \
       DATASTREAM_DIRECTORY="$HOME/.datastream_ngiab"    \
       VISUALIZER_CONF="$MODELS_RUNS_DIRECTORY/ngiab_visualizer.json" \
       TETHYS_PERSIST_PATH="/var/lib/tethys_persist"     \
       SKIP_DB_SETUP=false                               \
       CSRF_TRUSTED_ORIGINS="[\"http://localhost:${NGINX_PORT}\",\"http://127.0.0.1:${NGINX_PORT}\"]"
BASH
docker run --rm -d \
  -v "$MODELS_RUNS_DIRECTORY:$TETHYS_PERSIST_PATH/ngiab_visualizer" \
  -v "$DATASTREAM_DIRECTORY:$TETHYS_PERSIST_PATH/.datastream_ngiab" \
  -p "$NGINX_PORT:$NGINX_PORT" \
  --name "$TETHYS_CONTAINER_NAME" \
  -e MEDIA_ROOT="$TETHYS_PERSIST_PATH/media" \
  -e MEDIA_URL="/media/" \
  -e SKIP_DB_SETUP="$SKIP_DB_SETUP" \
  -e DATASTREAM_CONF="$TETHYS_PERSIST_PATH/.datastream_ngiab" \
  -e VISUALIZER_CONF="$TETHYS_PERSIST_PATH/ngiab_visualizer/ngiab_visualizer.json" \
  -e NGINX_PORT="$NGINX_PORT" \
  -e CSRF_TRUSTED_ORIGINS="$CSRF_TRUSTED_ORIGINS" \
  "${TETHYS_REPO}:${TETHYS_TAG}"
You should see something like this using docker ps
BASH
docker ps

CONTAINER ID   IMAGE                          COMMAND                  CREATED          STATUS                             PORTS                                 NAMES
b1818a03de9b   awiciroh/tethys-ngiab:latest   "/usr/local/bin/_ent…"   25 seconds ago   Up 24 seconds (health: starting)   0.0.0.0:80->80/tcp, [::]:80->80/tcp   tethys-ngen-portal
Once it’s healthy, you can access the visualizer at:
http://localhost:${NGINX_PORT}
The ViewOnTethys.sh script automates updating
ngiab_visualizer.json and copying your model output into
~/ngiab_visualizer.
Key points
-
ViewOnTethys.shautomates adding model outputs tongiab_visualizer.jsonand syncing data to~/ngiab_visualizer. - To customize your setup, set environment variables and run the
awiciroh/tethys-ngiabDocker image manually.
NGIAB Visualizer UI
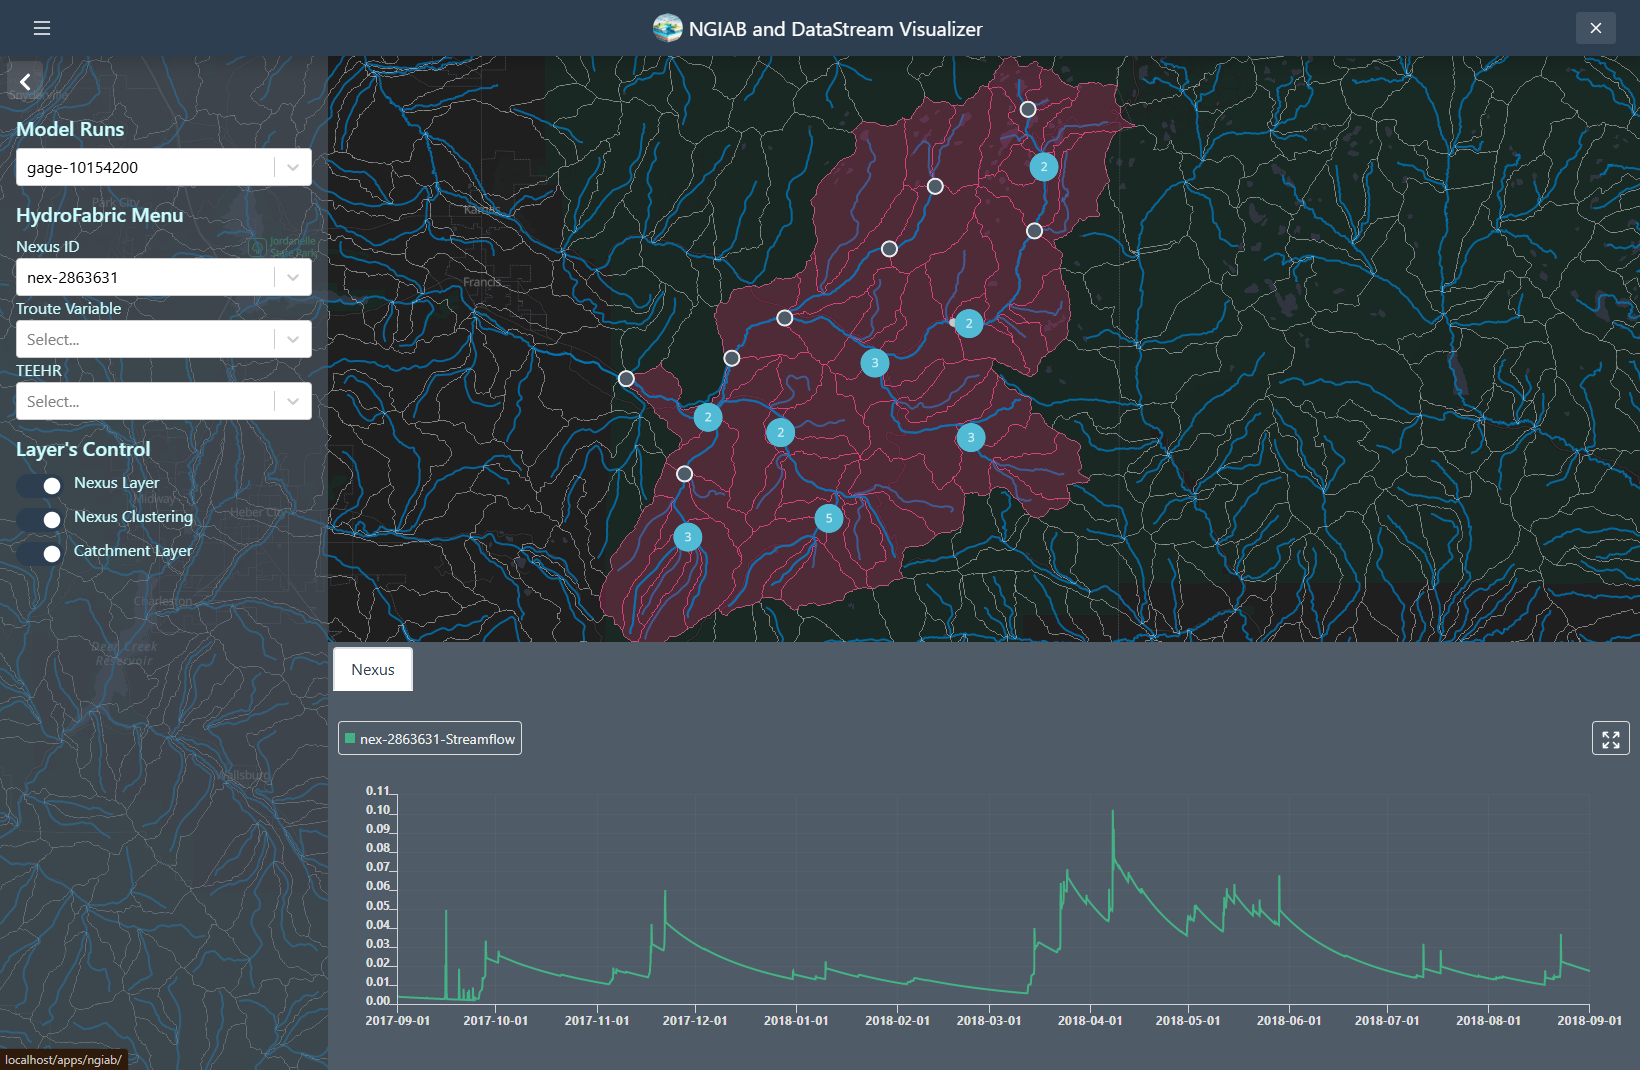
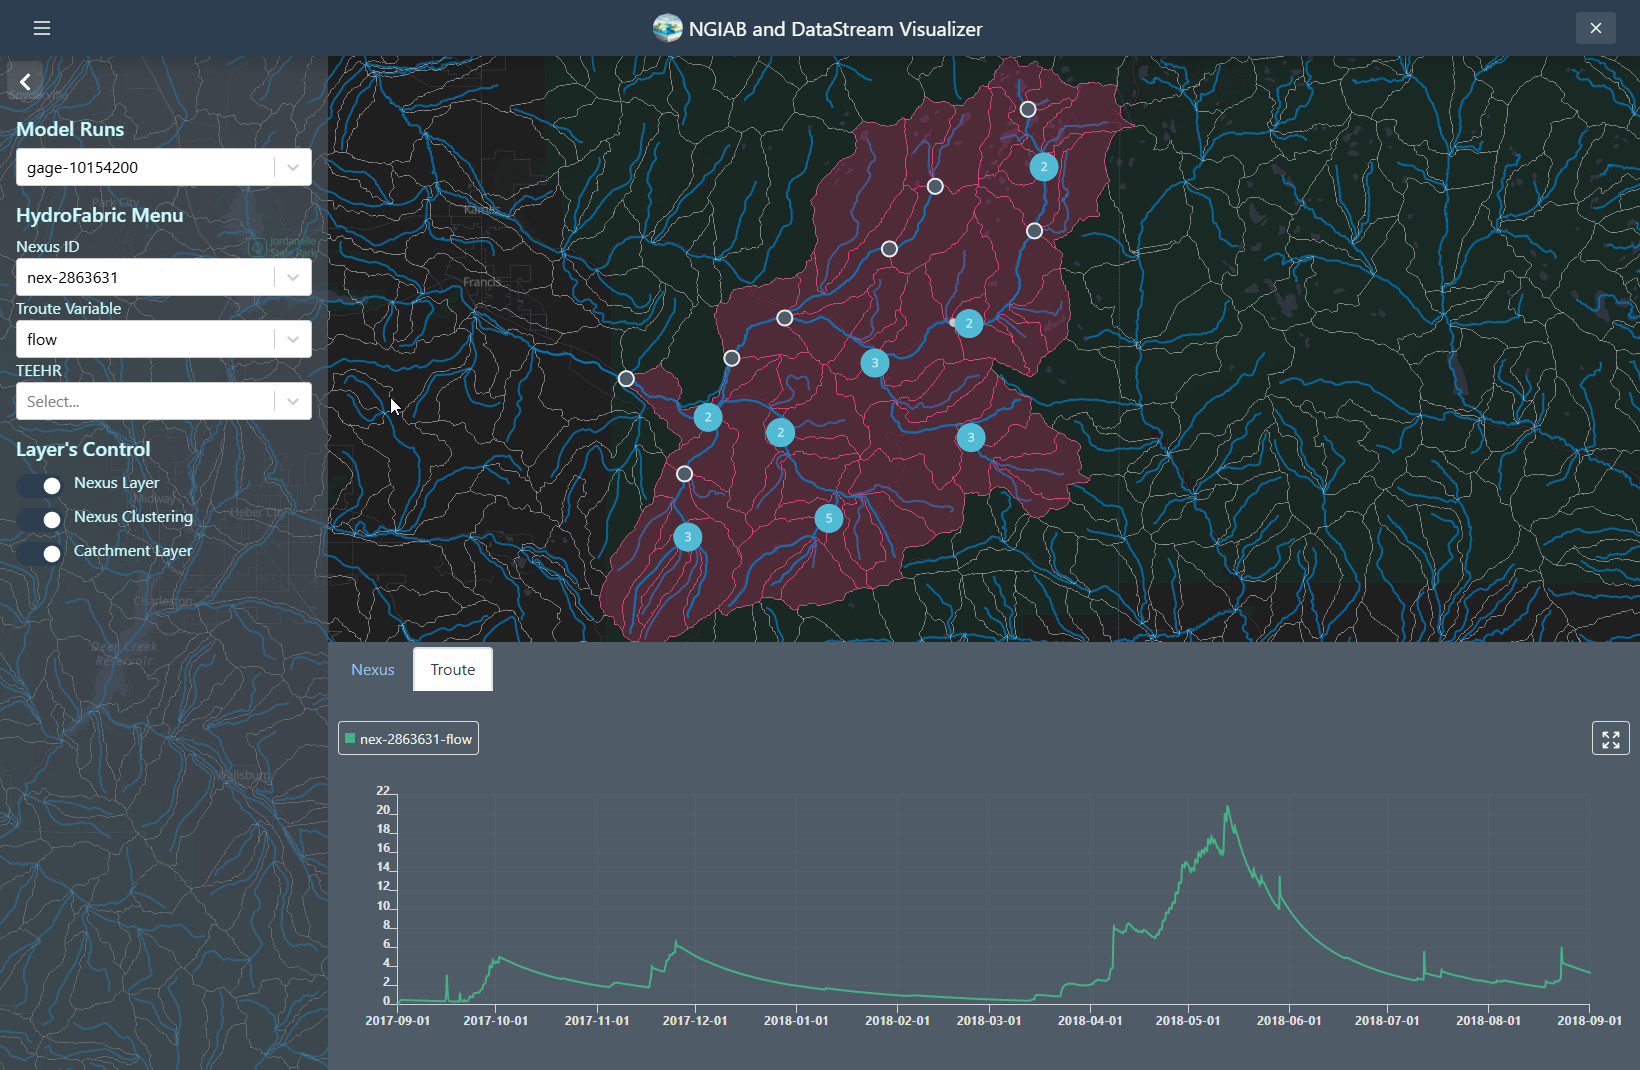
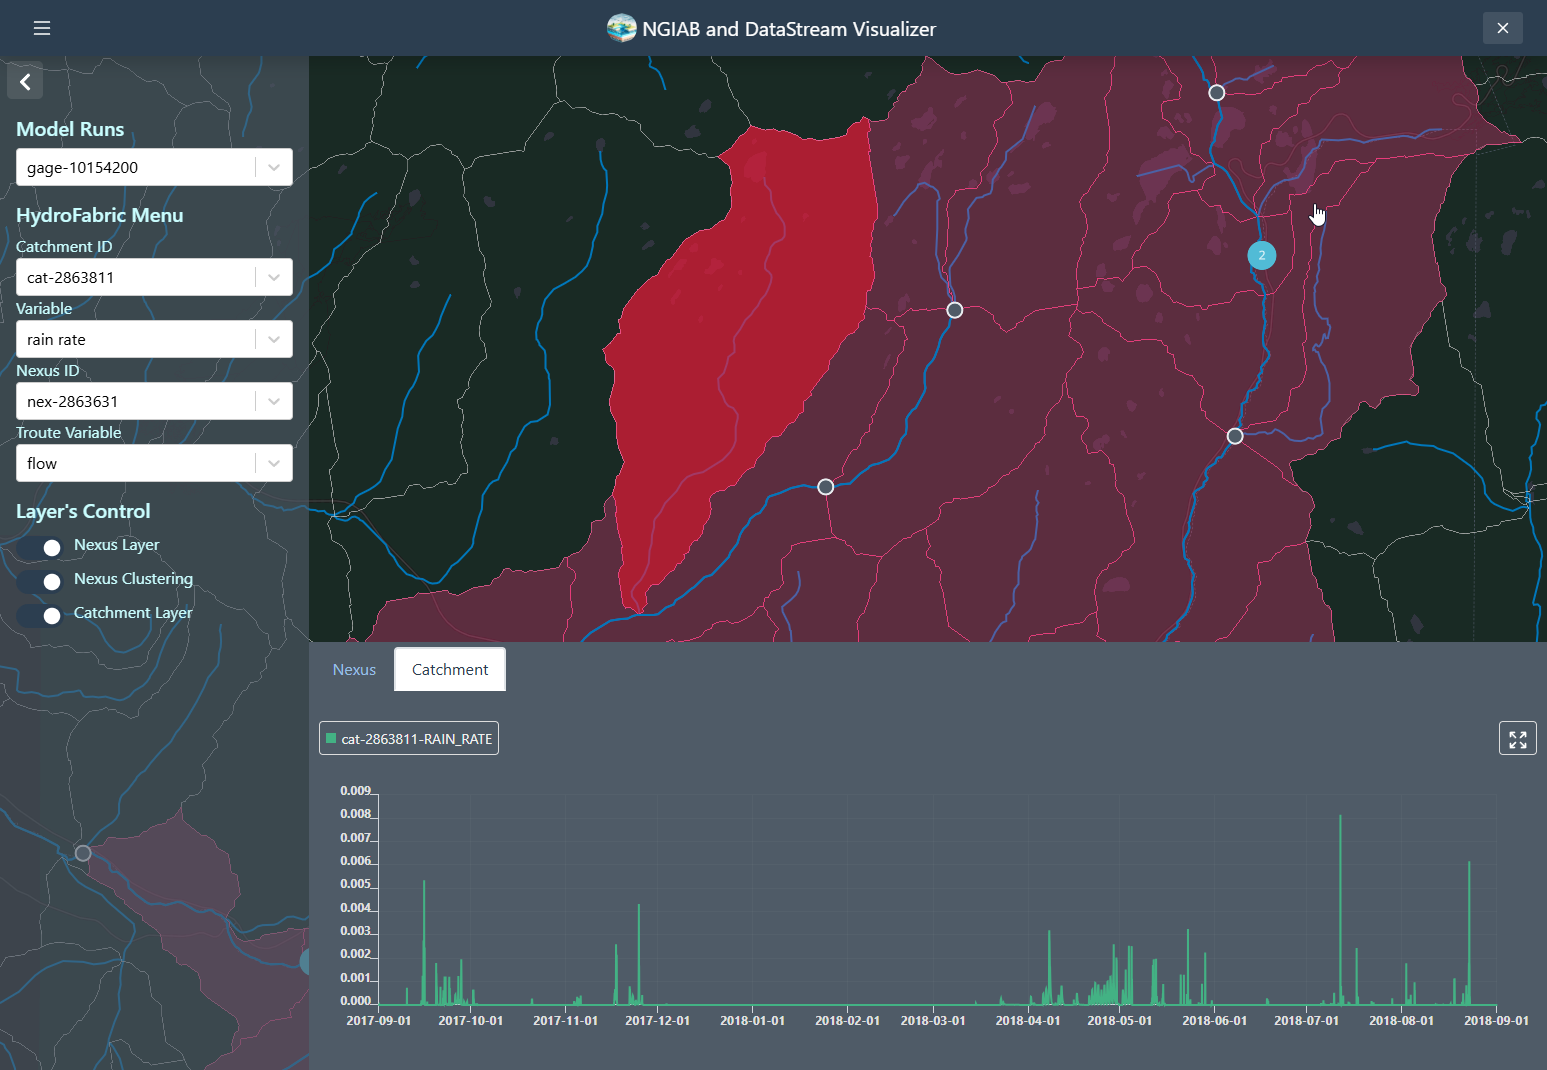
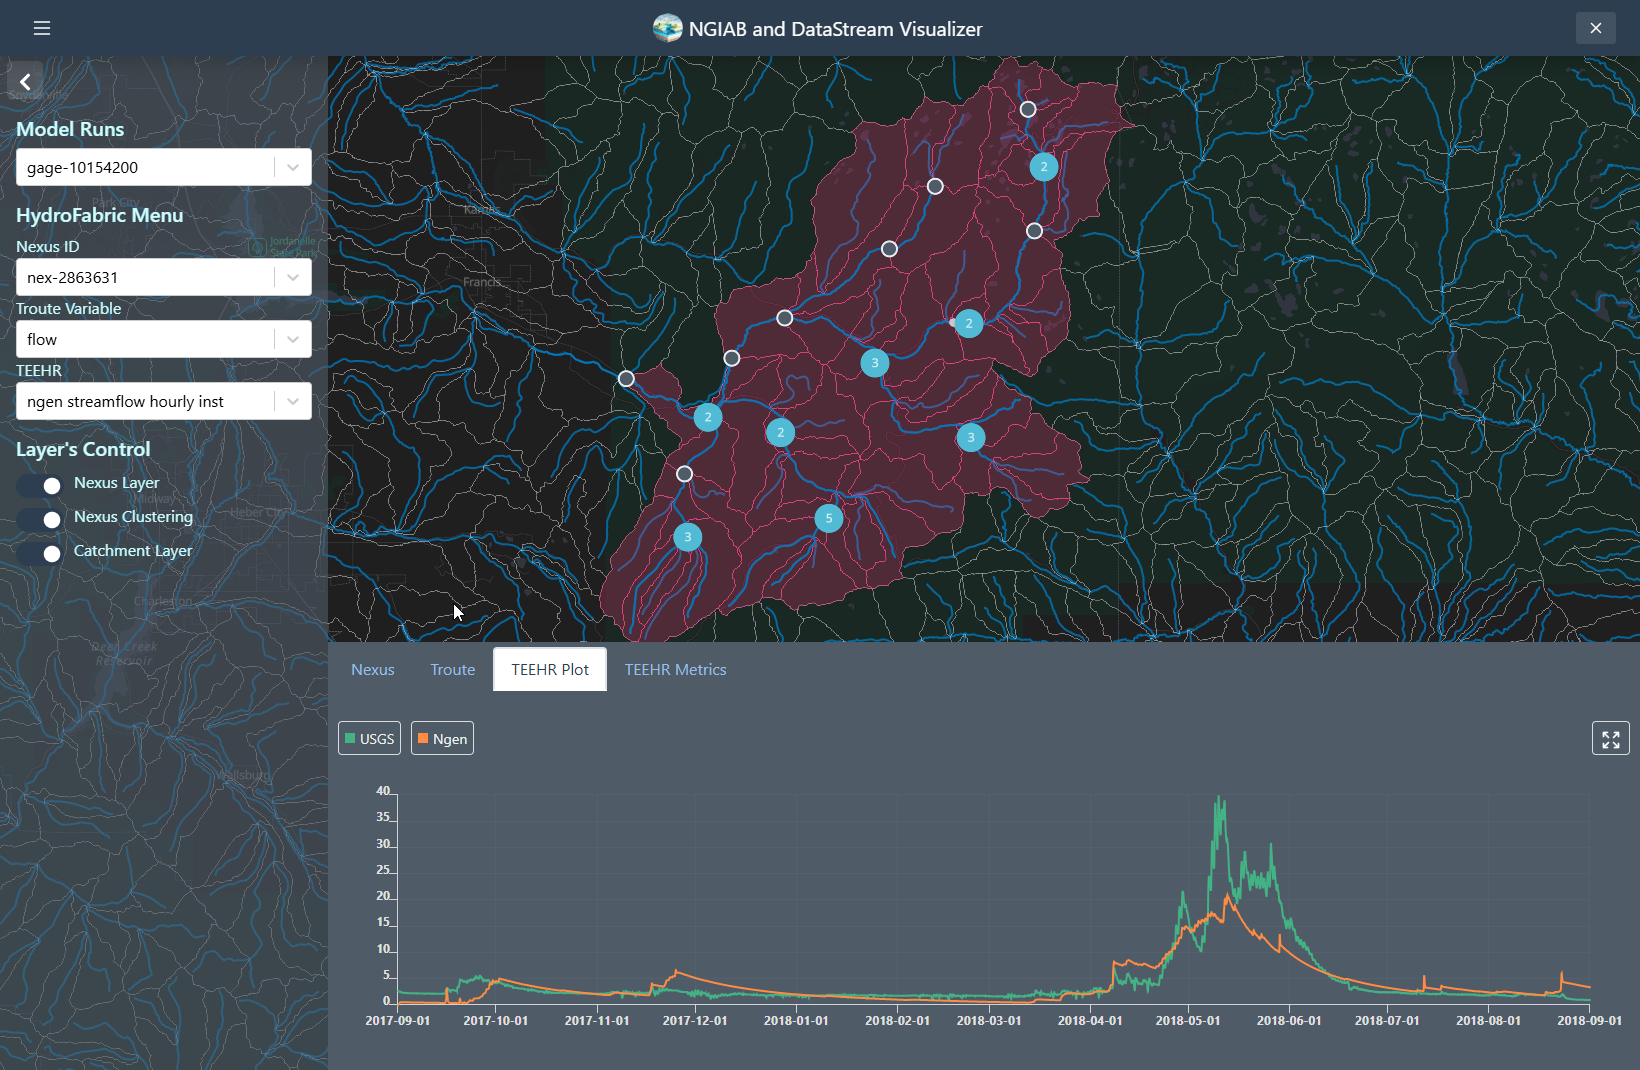
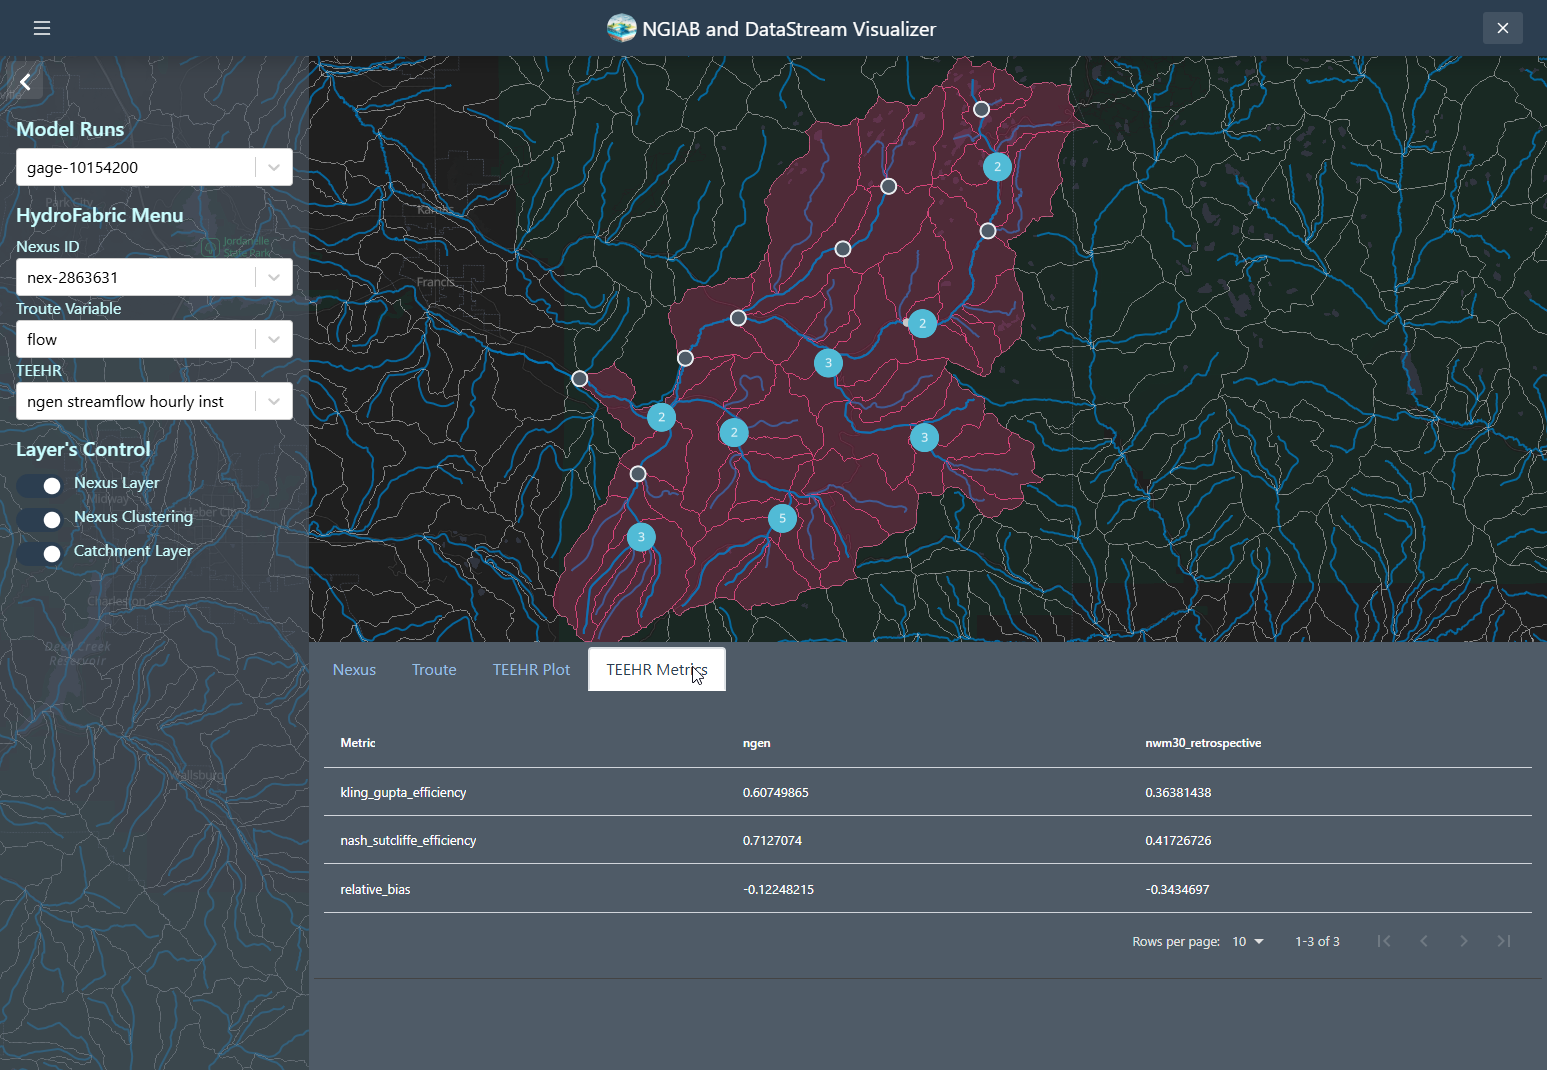
The following figures demonstrate several ways the Data Visualizer can be used to visualize model outputs, including geospatial visualization for nexus points, catchment-based visualization, and TEEHR time series representation (hydrographs).
Nexus points can be visualized when the user selects the output that wants to visualize. Time series can be retrieved by clicking on any of the Nexus points, or by changing the select dropdown assigned to the Nexus.
Troute variables time series can also be displayed using the Troute select dropdown.
Catchments time series can be retrieved by clicking on any of the Catchments polygons, or by changing the select dropdown assigned to the Catchments.
The TEEHR evaluation can be visualized when the user hits a point that contains TEEHR evaluation output. The user can also look at a Nexus point on the dropdown assigned and enter the id of the Nexus points that contains TEEHR evaluation output.
Similarly, a TEEHR evaluation metric can be visualized by going to the metrics tab
Using Data Visualizer with SSH
To use the Data Visualizer through a Secure Shell (SSH) connection, you will have to set up port forwarding when connecting to the remote machine. Port forwarding will allow you to access a remotely hosted browser session on your local machine. See the instructions under “Using NGIAB through an SSH connection” in the Advanced Topics episode in this training module.
Your Turn
Use the ViewOnTethys.sh script to launch the Data
Visualizer in Docker, then open
http://localhost:${NGINX_PORT} in your browser. Explore at
least three different visualization modes—such as Nexus time series,
catchment hydrographs, and TEEHR performance metrics. Next, edit
~/ngiab_visualizer/ngiab_visualizer.json to add a new model
run (define its label and path), restart the visualizer, and confirm it
appears in the dropdown menu.
- The Data Visualizer (built on the Tethys Platform) provides interactive geospatial maps and time series plots for NextGen model outputs in NGIAB.
- It integrates seamlessly with NGIAB via
guide.shorViewOnTethys.sh. - Model outputs reside under
~/ngiab_visualizer, with metadata stored inngiab_visualizer.json. - You can visualize Nexus points, catchment summaries, Troute variables, and TEEHR hydrographs and performance metrics.